
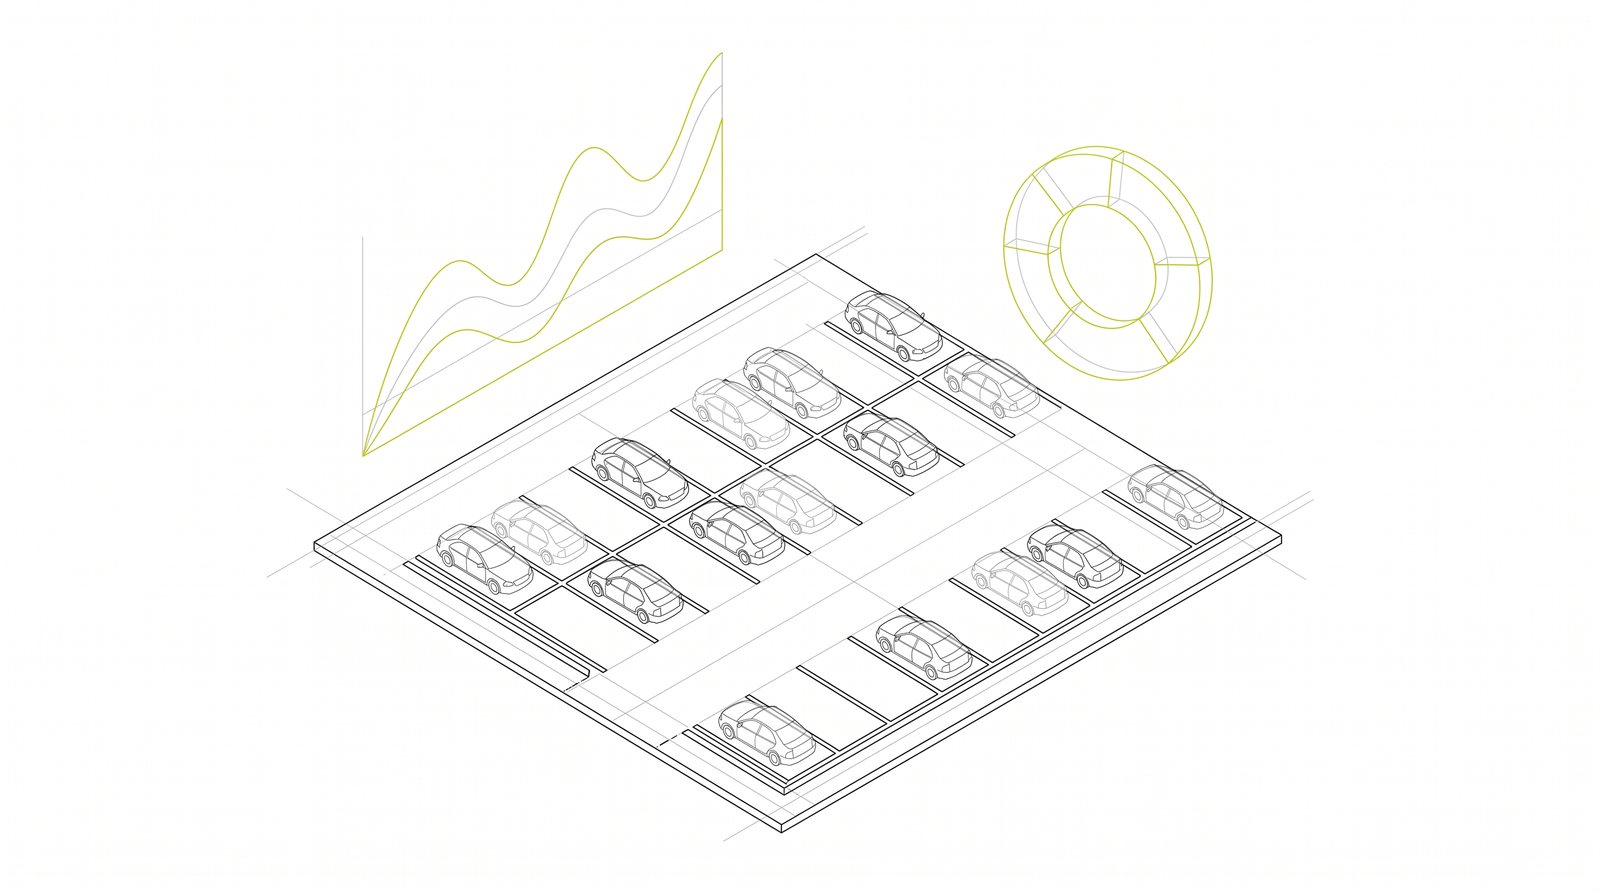
Occupancy of a parking area shows how many spaces are taken at any given time. With licence plate recognition, every parking session creates a data record with entry, exit, parking duration and payment. From this, occupancy over the course of the day, peaks, parking duration and revenue can all be read off, without anyone having to count manually.
The most common question is: Is the site big enough? The second most common: Are the prices right? The same data set answers both. What matters is limiting yourself to a few key figures, reviewing them regularly, and deriving decisions from them, such as a different tariff, a new time window, or a quota for a group.
Which key figures are enough?
Four figures are enough for most decisions. They show when the site is needed, how it is used, and whether the money is coming in.
The portal holds much more data: arrivals and departures, raw data and much more.
- Utilisation over the day
- Average parking duration
- Share of payment methods
- Outstanding receivables
Identify peaks and reduce traffic searching for parking
Parking search traffic occurs when vehicles arrive at a full site and have to look elsewhere. If the site is full for just a few hours and otherwise half empty, the problem is often not that the site is too small, but that demand is unevenly distributed.
An evening tariff, a weekend rate, a free first hour, or bookable tickets for events shift demand. Whether a change works shows up in the reports and analytics after a few weeks.
Keeping an eye on parking duration and long-term parkers
Parking duration shows whether the site is being used as intended. If many vehicles sit in a visitor car park all day, spaces are missing for short-term visitors.
A maximum parking duration, a different tariff, or separate terms for long-term parkers redistribute use of the site.
Passing on figures
Finance departments, management or owners want to see different figures than day-to-day operations. Exports and interfaces save manual retyping, for example into Power BI or a data platform, and much more besides.
Anyone passing on data should clarify beforehand which fields the target system expects.
In the PARQ system